AI in DevOps

Artificial Intelligence in DevOps

Artificial Intelligence is currently one of the most talked-about subjects, garnering more attention than ever before in its history since the term was initially coined in 1940. Before delving into the intersection of AI and DevOps, let’s have a quick recap of a few key terms to establish the context.

Highlights:

  • Key Terms Related to AI & DevOps
  • Changing Paradigm
  • How is Artificial Intelligence changing DevOps?
  • Challenges for Artificial Intelligence in DevOps

Key Terms Related to AI & DevOps

Artificial intelligence (AI)

Artificial intelligence (AI) is a set of technologies that enable computers to perform a variety of advanced functions, including the ability to see, understand, and translate spoken and written language, analyze data, make recommendations, and more.

What is Generative AI?

Generative artificial intelligence or generative AI (also GenAI) is a type of artificial intelligence (AI) system capable of generating text, images, or other media in response to prompts.

What is DevOps?

DevOps is a methodology in the software development and IT industry. Used as a set of practices and tools, DevOps integrates and automates the work of software development (Dev) and IT operations (Ops) as a means of improving and shortening the system’s development life cycle. DevOps is complementary to agile software development; several DevOps aspects came from the agile way of working.

Artificial Intelligence for IT Operations (AIOps)

Artificial Intelligence for IT Operations (AIOps) is a term coined by Gartner in 2016 as an industry category for machine learning analytics technology that enhances IT operations analytics. AIOps is the acronym for “Artificial Intelligence Operations.” Such operational tasks include automation, performance monitoring, and event correlations, among others.

Changing Paradigm

The term “Artificial Intelligence” was first coined by the father of AI, John McCarthy, in 1956. However, the revolution of AI actually began a few years earlier, in the 1940s. (Read more)

Modern AI is capable to See (using computer vision technologies), Hear (thanks to significant advancements in speech recognition technologies), Comprehend (effectively with the help of sophisticated algorithms), Sense (more accurately due to the democratization of big data and trained machine learning models), and finally, Act (faster and more precisely than ever before in history, fueled by rapid innovations in personal computing, internet, and cloud-native technologies).

Calling it “the third run-time,” Microsoft CEO Satya Nadella said that Artificial Intelligence is the “ultimate breakthrough” technology. He stated, “The operating system was the first run-time. The second run-time you could say was the browser. The third run-time can actually be the agent because, in some sense, the agent knows you, your work context and knows the work; and that’s how we’re building Cortana, and we are giving it a really natural language understanding.”

In simple terms, AI is the ability of machines to use algorithms to learn from data, utilize the knowledge gained to make decisions similar to humans, and take actions based on achieved intelligence or defined instructions.

How is Artificial Intelligence changing DevOps?

Today, almost every aspect of our lives is directly or indirectly impacted by AI. From small businesses, startups, mid-sized companies to large enterprises and governments, AI is being actively discussed. However, with the increased attention on AI, there is also some amount of hype leading to certain negative perceptions about its impact on the human workforce and jobs. In recent years, the classic debates about computers and machines taking over human jobs have shifted towards discussions about AI and robots taking over jobs.

DevOps, like every other aspect of business and personal lives, is also undergoing a transformation as AI takes a more central role in conversations. It is important to understand that with generative artificial intelligence, some of the key tasks and activities performed in DevOps can undergo changes.

1. Infrastructure Provisioning and Management

  • Estimating infrastructure capacity, sizing, and autoscaling can be improved as AI can perform better and faster analysis of historical usage data to take appropriate actions.
  • The integration of chatbots is a viable possibility to enhance management by providing smart prompts through desktop, browser, and mobile apps. For example, users can ask questions like “What percentage of CPU utilization?” or “How many active nodes are there in the load balancer?”, etc.

2. Security and Compliance

  • Better anomaly detection and compliance reporting for endpoints can be achieved with AI. It enables quick detection of anomalous activities, reclassification of endpoints, and faster enforcement of compliance remediation compared to human intervention.
  • AI-enabled agents can continuously monitor large amounts of network traffic data, proactively detect potential malware attacks, and be programmed to stop the attack or significantly reduce the attack surface.

3. Moving from Monitoring to Observability

  • Predicting application performance degradation and avoiding potential downtime often requires significant human effort in monitoring and analyzing logs proactively and reactively. However, AI can be utilized to predict potential downtime more accurately. With self-healing automation, AI can proactively implement remediation steps to mitigate issues.
  • By using more intelligent alerts, AI can effectively predict performance degradation, reducing alert fatigue on monitoring teams. It can also provide feedback to developers to improve logs and system performance.
  • As logging and alerts become more precise, AI-driven systems can assist with initial triages, allowing teams to focus on running more reliable and stable applications for the business.

4. Automated Testing and Quality Assurance

  • Hyper-automation optimizes business processes by integrating various automation tools and technologies. It goes beyond traditional test automation, incorporating AI and ML capabilities for intelligent automation of complex testing scenarios.
  • This integration offers benefits such as intelligent test case generation, adaptive test execution, improved test coverage, and predictive analysis for early defect detection.
  • AI and ML algorithms provide valuable insights from testing data, enabling organizations to optimize test strategies and make informed decisions.

5. Knowledge Sharing, Documentation, and Collaboration

  • Generative AI systems, capable of generating text, images, or other media in response to prompts, can effectively capture knowledge and facilitate documentation. For example, consider the article -‘Move resources to a new subscription or resource group – Azure Resource Manager | Microsoft Learn,’ which was partially created with the help of artificial intelligence.

AI generated article

  • By leveraging chatbots and virtual assistants, knowledge transfer can become more engaging and result-oriented, particularly in situations where time is a critical constraint for smooth handover between engineers.
  • AI’s real-time data delivery and analysis capabilities can augment the automation of repetitive and mundane tasks, improving collaboration across cross-functional teams.
  • Furthermore, AI advancements will influence existing enterprise search tools and technologies, which predominantly rely on text input and indexing models.
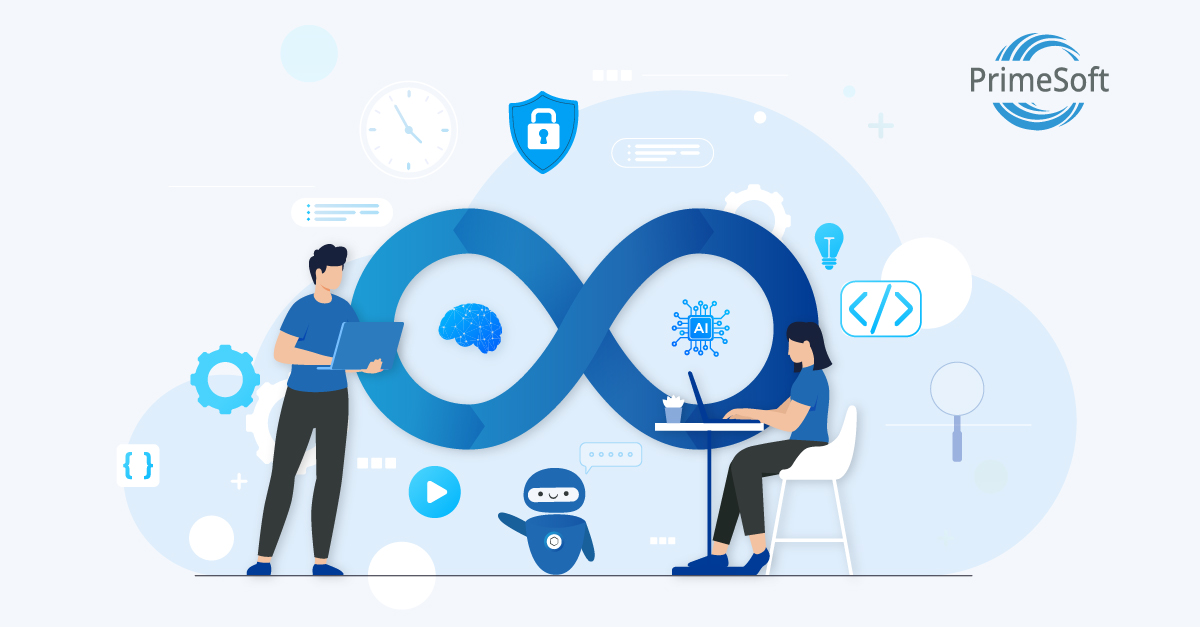
AI flow chart in DevOps

Challenges for Artificial Intelligence in DevOps

Considering the buzz around AI, everyone wants to quickly implement it into their systems and business processes. However, as with any new technology, there will be some uncertainty regarding its optimal utilization during the initial attempts. This uncertainty often leads to an exploratory approach, requiring multiple attempts to get it working right.

Based on our DevOps experience with numerous clients over the years, we have identified the following as the generic challenges in implementing AI in DevOps effectively.

1. Quantity and Quality of Enterprise Data

Meticulous planning is required to ensure sufficient and high-quality data availability to feed into machine learning models before further utilization.

2. Hiring and Training Skilled Workforce

Challenges in recruiting and training a skilled workforce to handle AI projects can impact the integration of AI into existing DevOps tools and systems.

3. Managing AI Models

Sustaining and managing AI models in the long run, ensuring they run without biases, misinformation, and copyright violations, necessitates specialized skills and a dedicated workforce.

4. Ethical Considerations

Addressing ethical considerations and ensuring responsible AI implementation goes beyond technical aspects, requiring close collaboration among stakeholders to ensure a responsible and ethical approach.

Final Thoughts

Over the next 10 years, AI will maintain its dominant presence in all fields of work and serve as a significant driving force behind every business idea, directly or indirectly. DevOps has already embarked on a transformational journey and will continue to witness rapid changes in the way IT and Software Services companies of all sizes embrace and innovate with it, ultimately adding value to their core business and customers.
Retrospective Dashboard Queries_Splunk

Retrospective Dashboard Queries in Splunk

Splunk is widely used by organizations to monitor and troubleshoot IT infrastructure and applications. It is employed in many industries, such as healthcare, finance, and retail, to gain insights into their operations, security, and compliance and make data-driven decisions.

In this post, let’s see how to create Retrospective dashboard queries in Splunk with a simple scenario with a sample data.

Highlights:

  • What Is Splunk? 
  • PrimeSoft’s Expertise on Splunk
  • Retrospective Data Analysis Demo

What Is Splunk?

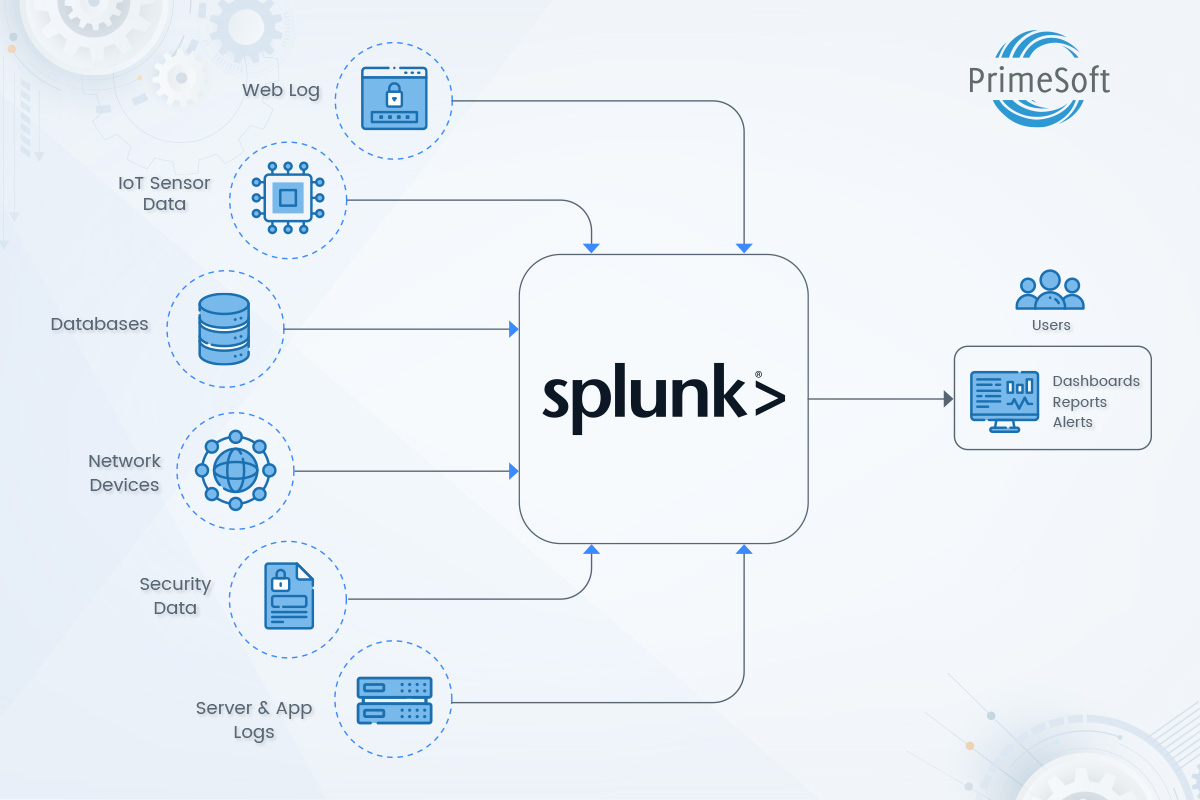
Splunk is a software designed to collect, analyze, and visualize large amounts of machine-generated data, such as log files, network traffic data, and sensor data. It offers a wide range of capabilities for searching, analyzing, and visualizing data, as well as building and deploying custom applications.

The software can be deployed on-premises or in the cloud, and offers a wide range of APIs and integrations with other systems, enabling users to collect data from various sources easily. It indexes and correlates information in a container, making it searchable, and enables the generation of alerts, reports, and visualizations.

Additionally, Splunk has a large and growing ecosystem of add-ons and integrations with other tools, making it a popular choice for organizations that need a flexible and scalable data analysis solution.

PrimeSoft’s Expertise on Splunk

PrimeSoft has good expertise on Splunk as we have helped our customers monitor and troubleshoot alerts received from multiple systems in both Production and Non-Production environments for business-critical applications.

Our experts have helped customers analyze, set up, rationalize, and perfect the alerts for maximizing the coverage of applications and infrastructure monitoring with effective alerts put into the right place. They have also been instrumental in creating various monitoring and reporting dashboards in Splunk, helping key customer stakeholders by offering critical business insights in a dashboard. Based on the lessons learned, our expert is sharing how to create retrospective dashboard queries in Splunk.

Retrospective Data Analysis Demo

To draw insights and make informed decisions, one must retrospectively look at historical data to uncover trends, patterns, and relationships.

Sample Data

In this demo, let’s use sample data with Users’ Login count for every hour throughout the year 2022. We will start with uploading the sample data in a CSV file to the Splunk Cloud (trial version). You can use the Splunk free trials available by following the process here.

The data contains only two columns, DateTime and UserLogins, as shown below.

Sample Data for Splunk Cloud

Figure 1

Uploading the Sample Data

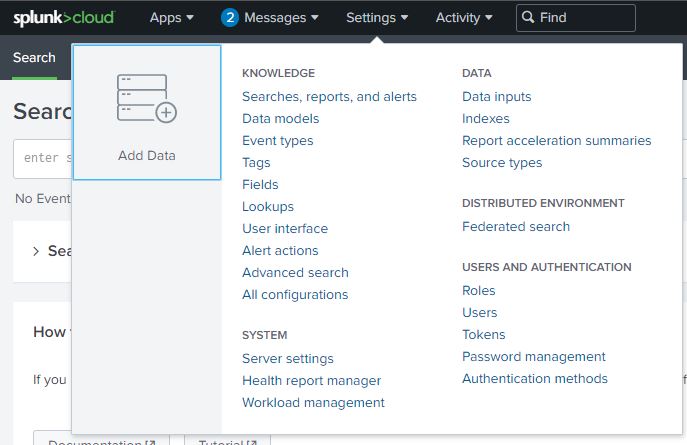
To upload data, navigate to the Searching and Reporting view in Splunk Cloud, click on Settings to see the Add Data option, and follow the process.

Add Data_Splunk Cloud Settings

Figure 2

Building Queries and Visualizing Data

Let’s build queries to help us visualize data trends in the following scenarios.

  • Scenario 1 – Weekday & Weekly Trend Comparison (when log timestamp and _time field are same)
  • Scenario 2 – Monthly Trend Comparison (when log timestamp and _time field are NOT same)
  • Scenario 3 – Monthly Trend Comparison (when log timestamp and _time are in matching but need to be reported in different time zone)
Scenario 1

Let us assume that the log timestamp values are perfect and match with the default “_time” field in the Splunk index. We can use just two commands, timechart, and timewarp, to achieve retrospective data comparison.

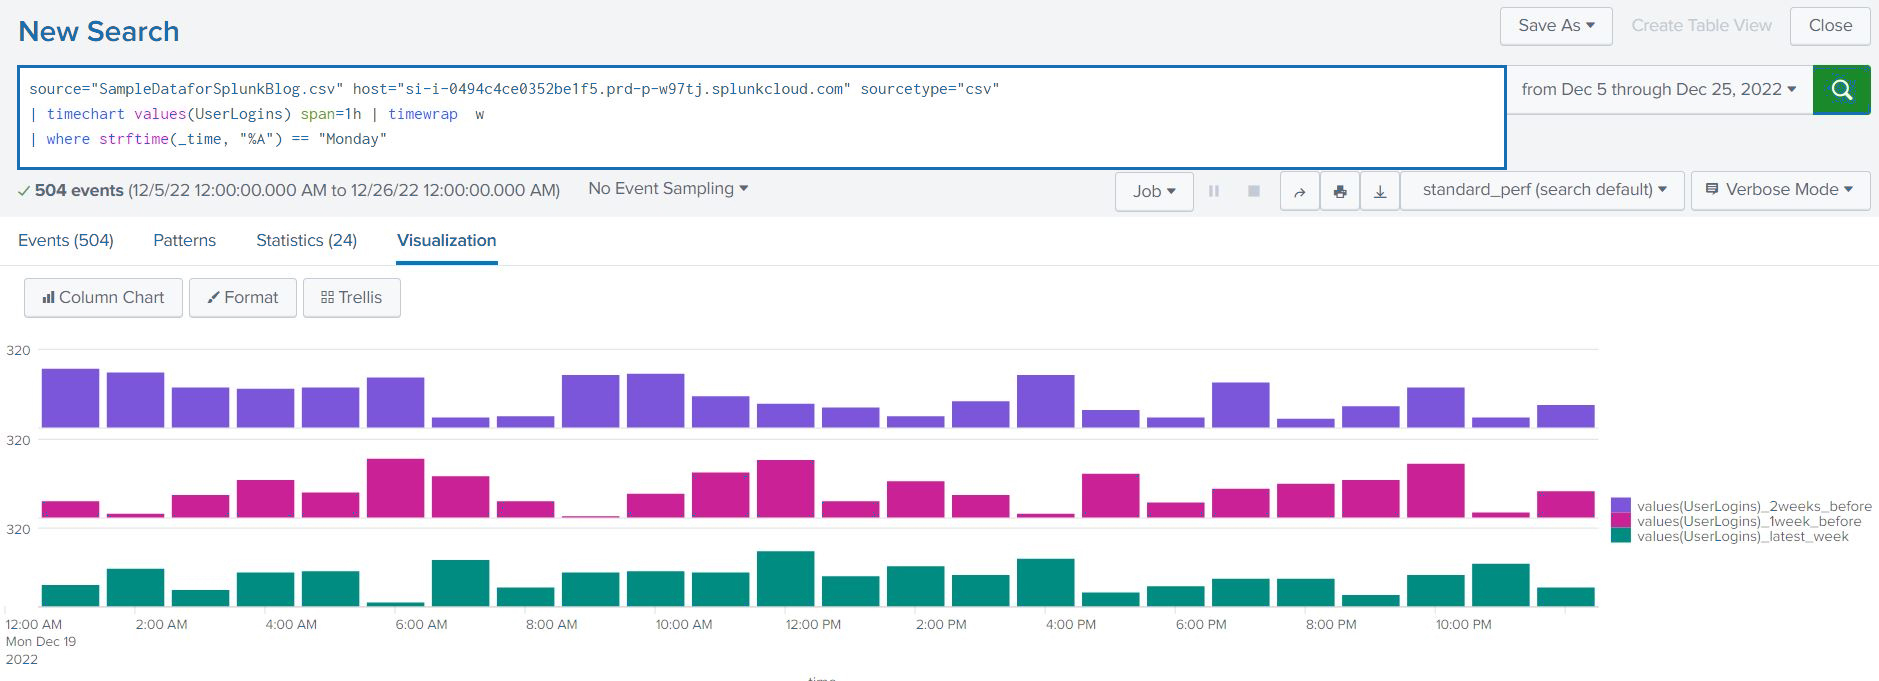
The Query for Weekday Data Comparison
source=”SampleDataforSplunkBlog.csv” host=”si-i-0494c4ce0352be1f5.prd-p-w97tj.splunkcloud.com” sourcetype=”csv” | timechart values(UserLogins) span=1h | timewrap  w | where strftime(_time, “%A”) == “Monday”
  • The first line of the query fetches the data.
  • The second line time chart command creates data points based on the UserLogins field for every hour (Span=1h) and the timewrap command wraps the data points created earlier by week (w). 
  • Finally, in line three, we filter based on the weekday we wish to compare the metrics. 
  • Additionally, we confined the search period to only 3 weeks. We will see the same weekday data from previous weeks if we increase it.

Query for Weekday Data Comparison_Splunk

Figure 3.1

Query for Weekday Data Comparison_Splunk

Figure 3.2

Similarly, we can build a query for Weekly User Login data comparison.

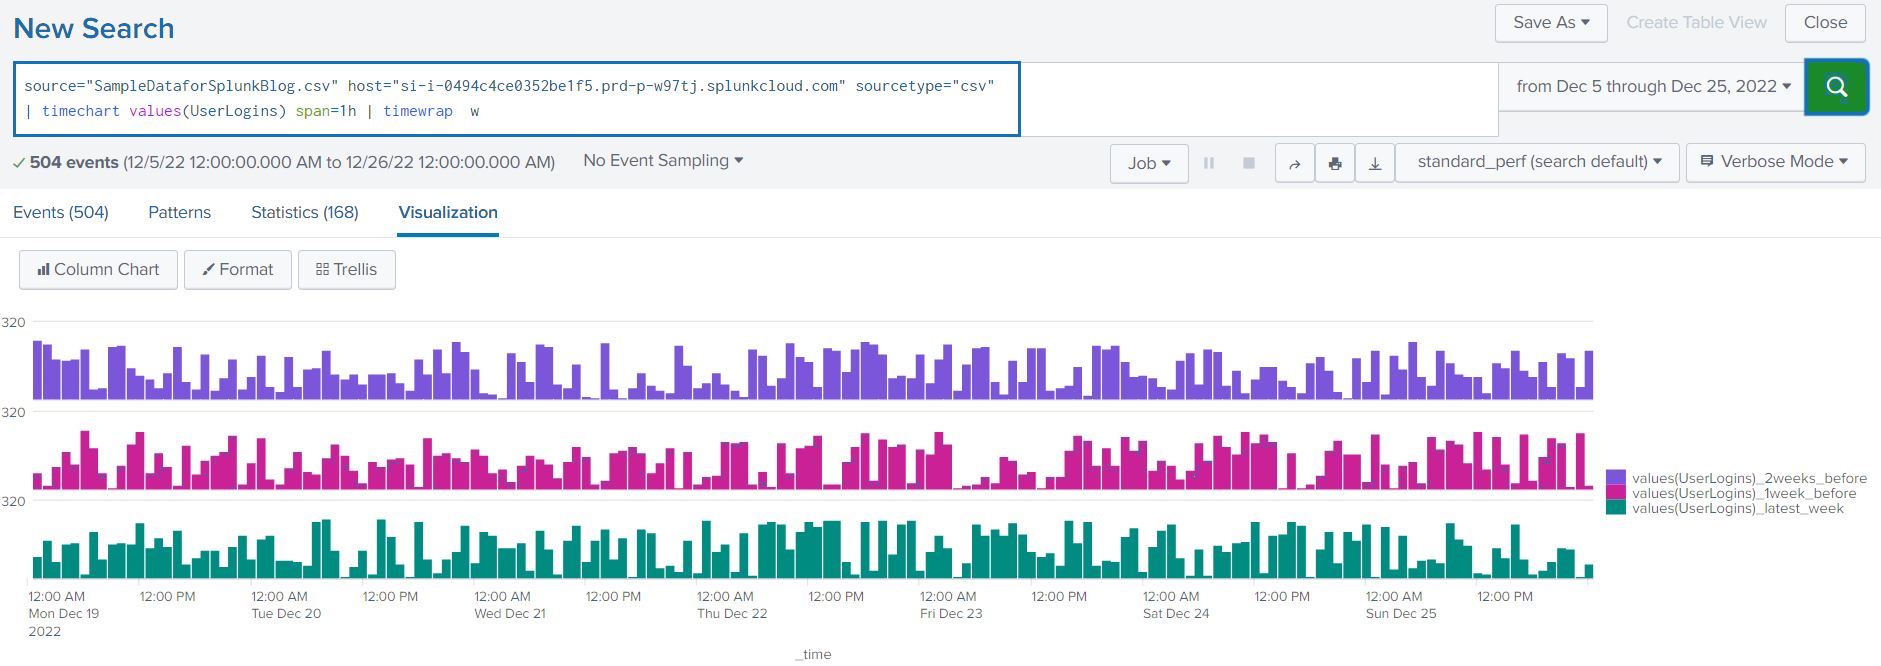
The Query for Weekly Data Comparison
source=”SampleDataforSplunkBlog.csv”
host=”si-i-0494c4ce0352be1f5.prd-p-w97tj.splunkcloud.com” sourcetype=”csv” 
| timechart values(UserLogins) span=1h | timewrap  w
  • The first line of the query fetches the data.
  • In the second line, the timechart command creates data points based on the UserLogins field for every hour (Span=1h) and the timewrap command wraps the data points created earlier by week (w).
  • We confined the search period to only 3 weeks and if we increase it, we will observe data from previous weeks for comparison.

Query for Weekday Data Comparison_Splunk

Figure 4.1

Query for Weekly Data Comparison_Splunk

Figure 4.2

By updating the Span to 1 day and adding the User log-in values by replacing values() with the sum() function, we can generate aggregated data points per day to compare over 3 or more weeks based on the search period.

source=”SampleDataforSplunkBlog.csv”
host=”si-i-0494c4ce0352be1f5.prd-p-w97tj.splunkcloud.com” sourcetype=”csv” 
| timechart sum(UserLogins) span=1day | timewrap  w

Query for Weekly Aggregated Data Comparison_Splunk

Figure 5.1

Query for Weekly Aggregated Data Comparison_Splunk

Figure 5.2

Read more about timechart and timewarp commands in the Splunk documentation through the hyperlinks. These commands are highly customizable through inputs, which can help us to build many versions of Retrospective Metrics.

Scenario 2

Let’s assume that the log timestamp values are NOT matching with the default “_time” field in the Splunk index. In this case, we will have to use additional commands such as eval, chart, etc.

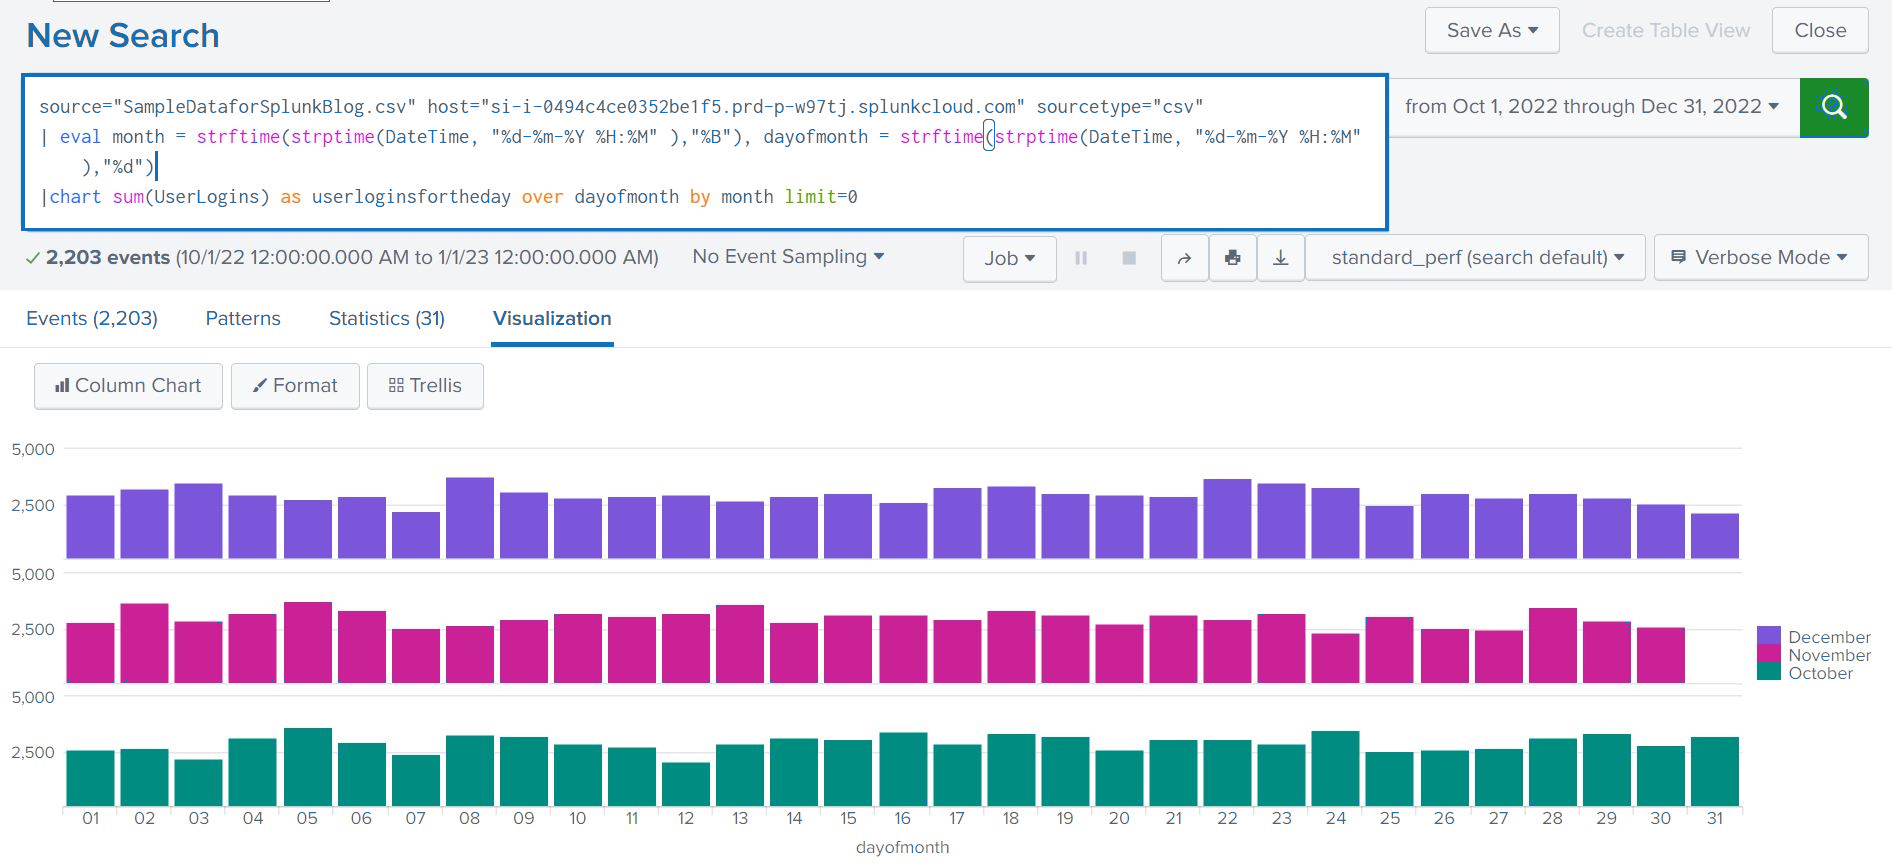
The Query for Monthly Data Comparison
source=”SampleDataforSplunkBlog.csv”
host=”si-i-0494c4ce0352be1f5.prd-p-w97tj.splunkcloud.com” sourcetype=”csv”   
| eval month = strftime(strptime(DateTime, “%d-%m-%Y %H:%M” ),”%B”),
dayofmonth = strftime(strptime(DateTime, “%d-%m-%Y %H:%M” ),”%d”)
|chart sum(UserLogins) as userloginsfortheday over dayofmonth by month limit=0
  • The first line of the query fetches the data.
  • In the second line, we are using the strftime and strptime Data-Time functions from Splunk to calculate the Day of the Month and Month fields. 
  • Finally, in line three, we use the chart command to calculate the Sum of User Logins per day and chart it over the day of the month for each month to compare. 
  • Additionally, we confined the search period to only 3 months, and by increasing it, we will be able to observe daily data from prior months. 

Query for Monthly Data Comparison_Splunk

Figure 6.1

Query for Monthly Data Comparison_Splunk

Figure 6.2

Scenario 3

Let’s assume that the log timestamp and _time field in the Splunk index match, but need to be reported in the preferred time zone.  Timestamp in this example is in the GMT zone and the query will help report it in the user’s preferred time zone in the user settings.

The Query for Monthly Data Comparison
source=”SampleDataforSplunkBlog.csv”
host=”si-i-0494c4ce0352be1f5.prd-p-w97tj.splunkcloud.com” sourcetype=”csv” 
| eval dtime=strftime(_time, “%d-%m-%Y %H:%M”)  
| eval DTimeZone=dtime+” GMT” 
| eval DTime=strftime(strptime(DTimeZone,”%d-%m-%Y %H:%M %Z”),”%d-%m-%Y %H:%M %Z”) 
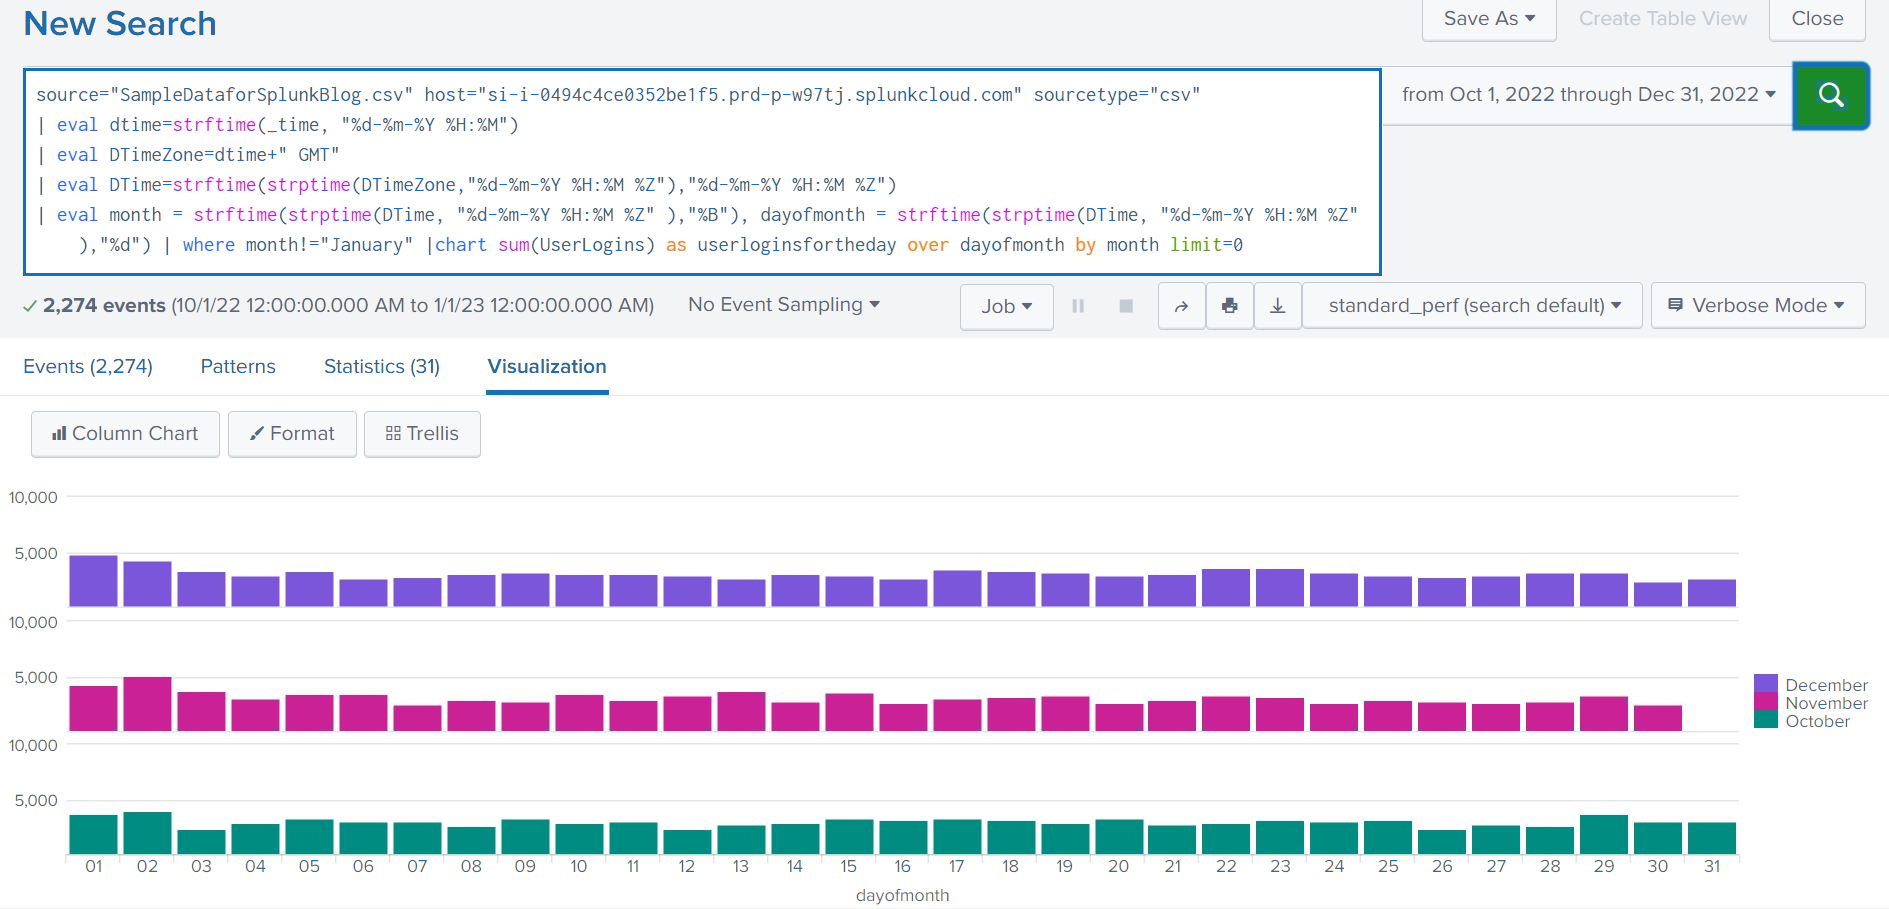
| eval month = strftime(strptime(DTime, “%d-%m-%Y %H:%M %Z” ),”%B”),
dayofmonth = strftime(strptime(DTime, “%d-%m-%Y %H:%M %Z” ),”%d”) 
|chart sum(UserLogins) as userloginsfortheday over dayofmonth by month limit=0
  • The first line of the query fetches the data.
  • In line two, we are using strftime to convert from UNIX to the general Date-Time format. 
  • In line three, we are adding the Time zone as GMT, assuming the logs are in GMT.
  • In line four, we are using strftime and strptime to convert the Date-Time from GMT to the current user’s time zone setting.
  • In line five, we are calculating the Month and Day of the Month.
  • Finally, in line six, we use the chart command to calculate the Sum of User Logins per day and chart it over the day of the month by each month in order to compare them. 
  • Additionally, we confined the search period to only 3 months, and by increasing it, we will be able to see daily data from previous months. 

Query for Monthly Data In Preferred Timezone_Splunk

Figure 7.1

Query for Monthly Data In Preferred Timezone_Splunk

Figure 7.2

Thank you for reading. We hope you learned something new that will help you build retrospective queries to analyze your data patterns.


Durable Task Framework

What Is Durable Task Framework?

The Durable Task Framework (DTFx) allows users to write long running, persistent workflows in C# using the .Net framework and simple async/await coding constructs.

These workflows are also called orchestrations and require at least one provider (a backend persistence store ) for storing the orchestration message and runtime state. It provides a low-cost alternative for building robust workflow systems. The open-sourced Microsoft library is accessible here.

In this post, let’s understand how the Durable Task Framework works.

Highlights:

  • What Problem Can a Durable Task Framework Solve?
  • Key Features Of The The Framework
  • Why Is It Important In Cloud-Native Application Development?
  • How Does Azure Durable Task Work?
  • Basic Sample Solution To Demonstrate Durable Task Framework In Use
  • Key Takeaways

What Problem Can a Durable Task Framework Solve?

The framework is designed to allow users to build workflows using code. If processing can take a long time or one of the business requirements is to prepare a state machine or use a workflow engine, the Durable Task is an ideal option. It can also be a link between many microservices or act as a distributed component.

Key Features Of The Framework

  • The solution is lightweight and simple.
  • Workflows are defined in code, which makes them customizable.
  • The DTFx uses the Event Sourcing approach to store all actions in Azure Table Storage. Thanks to this feature, we can rerun the processes from the past or re-initiate the process from a state where the activity was interrupted.
  • The persistent state feature of DTFx allows for managing long running complex processes and helps to reduce the time duration.
  • Versioning of orchestrations and activities helps track changes.
  • DTFx supports an extensible set of backend persistence stores such as Service Bus, Azure Storage, SQL Service, Service Fabric, etc., and requires minimal knowledge of the services.

Why Is It Important In Cloud-Native Application Development?

Cloud Native Applications promote a loosely coupled, microservices-based application architecture. The Durable Task Framework enables the building of such applications, where most of the work in building a complex workflow system is done by the DTFx. Today, all leading cloud solution providers offer a Durable Task Framework, making it a cost-effective alternative for building high-performance workflow systems.

  • Durable Functions and Azure Functions are good examples of how the Durable Task Framework is being extended to offer cloud-native solutions on Azure.
  • AWS SWF (Simple Workflow Framework), a web service that facilitates coordination of work across distributed application components, is another good example of using the Durable Task Framework to coordinate tasks, manage execution dependencies, schedule and handle concurrency in accordance with the application’s logical flow
  • Google Cloud Tasks is a fully managed service that lets you manage the execution, dispatch, and delivery of a large number of distributed tasks.

How Does Azure Durable Task Work?

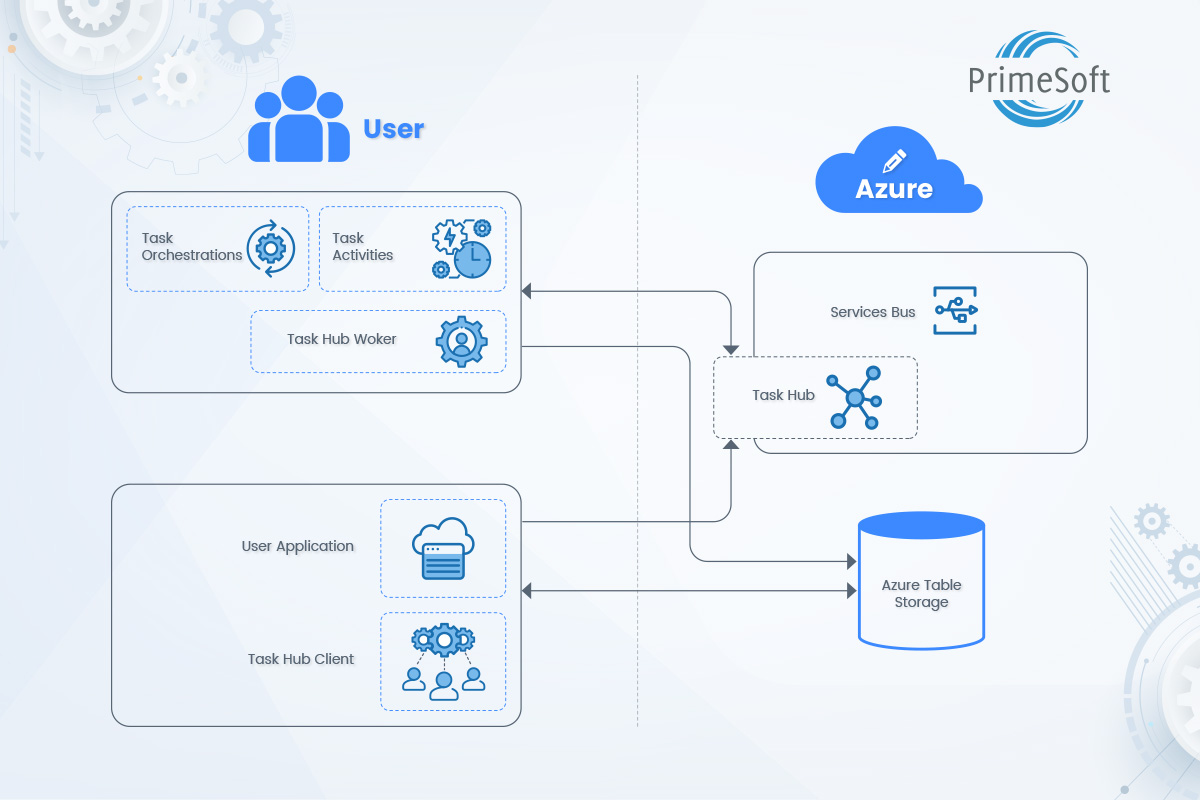
The Durable Task Framework consists of several components that work together to manage and execute orchestrations and activities. Let us take a look at the different components and how this is accomplished.

Task Hub: It is a logical container for Service Bus entities used by the Task Hub Worker to reliably pass messages between code orchestrations and the activities they orchestrate.

Task Activities: These are pieces of code that perform specific steps of the orchestration. A Task Activity can be ‘scheduled’ from within some Task Orchestration code. This scheduling results in a plain vanilla .NET Task that can be serviced (asynchronously) and that can be composed with other similar Tasks to build complex orchestrations.

Task Orchestration: This is where you can schedule Task Activities and build code orchestrations around the Tasks that represent the activities.

Task Hub Worker: This hosts Task Orchestrations and Activities. It also contains APIs for performing CRUD operations on the Task Hub itself.

Task Hub Client

The Task Hub Client provides:

  • APIs to create and manage task orchestration instances
  • APIs to query the state of Task Orchestration instances from an Azure Table

The Task Hub Worker and Task Hub Client are connected to the Service Bus and Azure Table Storage via connection strings. The Service Bus is used for storing the execution control flow state and passing messages between Task Orchestration instances and Task activities.

Since the Service Bus is not meant to be a database, the state is removed from the Service Bus once the code orchestration is complete. However, if an Azure Table storage account is linked, this state is available for queries as long as the user stores it.

The framework provides Task Orchestration and Task Activity base classes from which we can derive to specify orchestrations and activities. Then use the Task Hub APIs to load these orchestrations and activities into the process and then start the worker that begins processing requests to create new orchestration instances.

The Task Hub Client APIs are used to create new orchestration instances, query existing instances, and terminate those instances as needed.

We start by creating a new orchestration instance that loads all activities into the Service Bus as a control flow, based on the orchestration definition. All activities are then executed one by one. This process ensures that all actions are invoked only once. If something goes wrong with the application and the problem is resolved, the framework resumes from the exact activity it was executing at the time of the crash.

Basic Sample Of Durable Task Framework Implementation

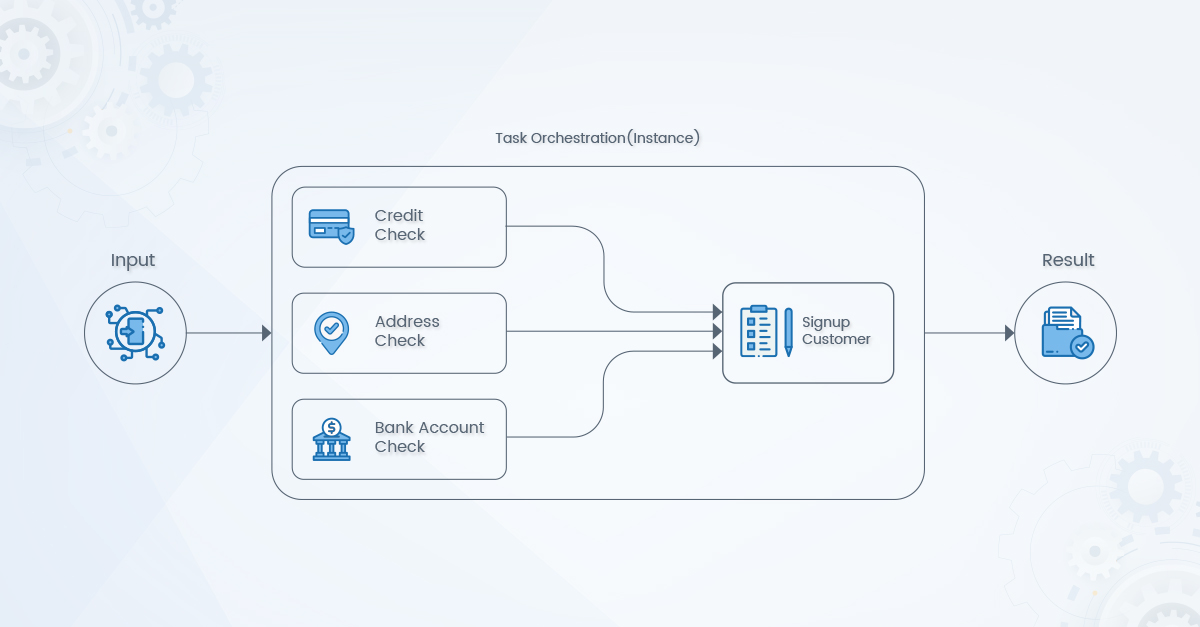
This solution aims to demonstrate DTFx using a simple scenario of a Customer Sign up. The Task Orchestration is the complete signup process and the Task Activities are different steps performed to achieve this.

We have 4 Task Activities: Address Check (PerformAddressCheckAsync), Credit Check (PerformCreditCheckAsync), Bank Account Check (PerformBankAccountCheckAsync), and Sign Up Customer. 

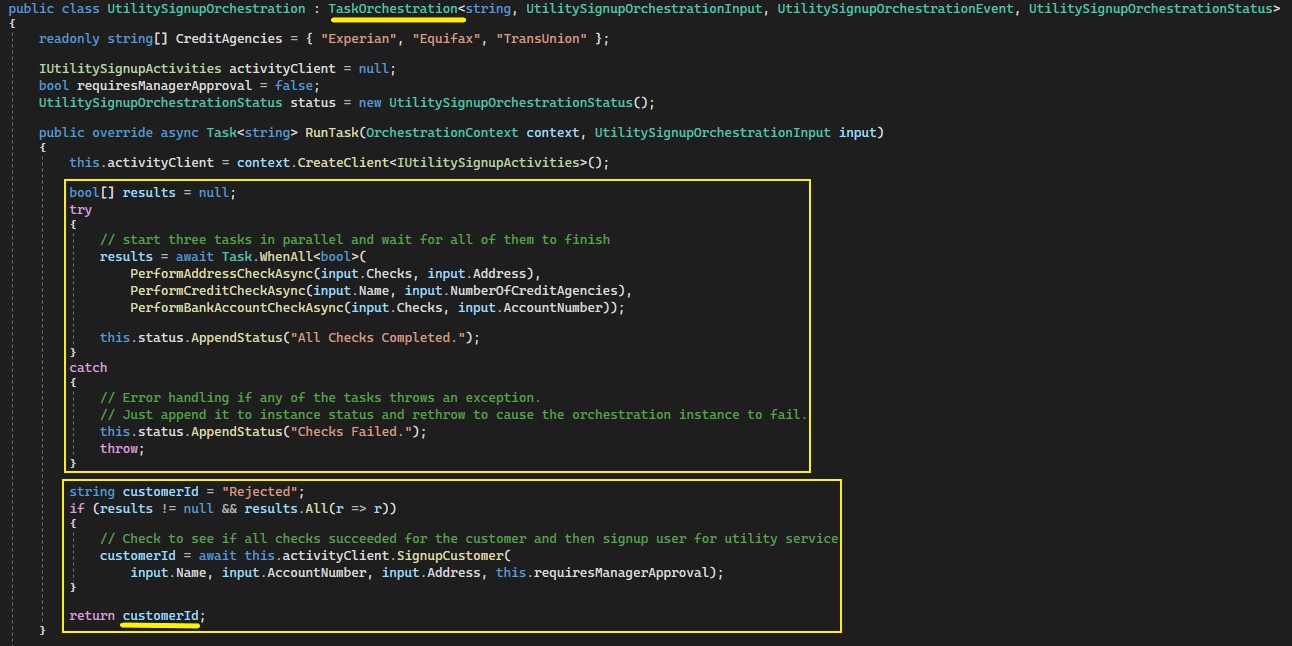
The three checks are executed in parallel, and once they are completed, the Signup Customer Task is invoked. This returns the ID only if all checks were successful, or rejects it with a ‘REJECTED’ message if one or more checks fail.

The Credit Check Task is a data-driven asynchronous process. It relies on the ‘NumberOfCreditAgencies’ value passed as input to the workflow.

Task Orchestration Instance

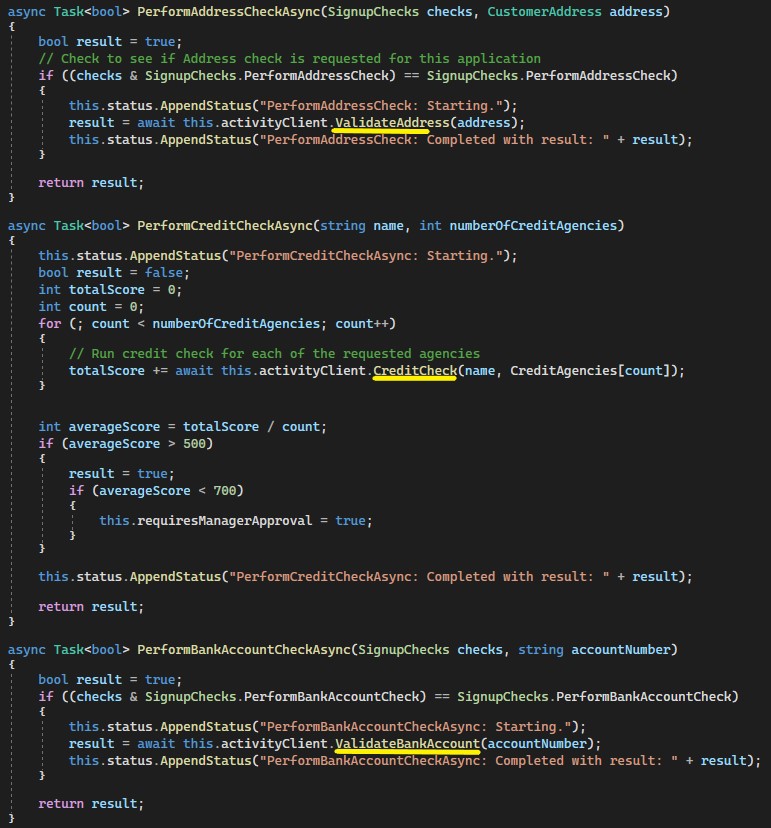
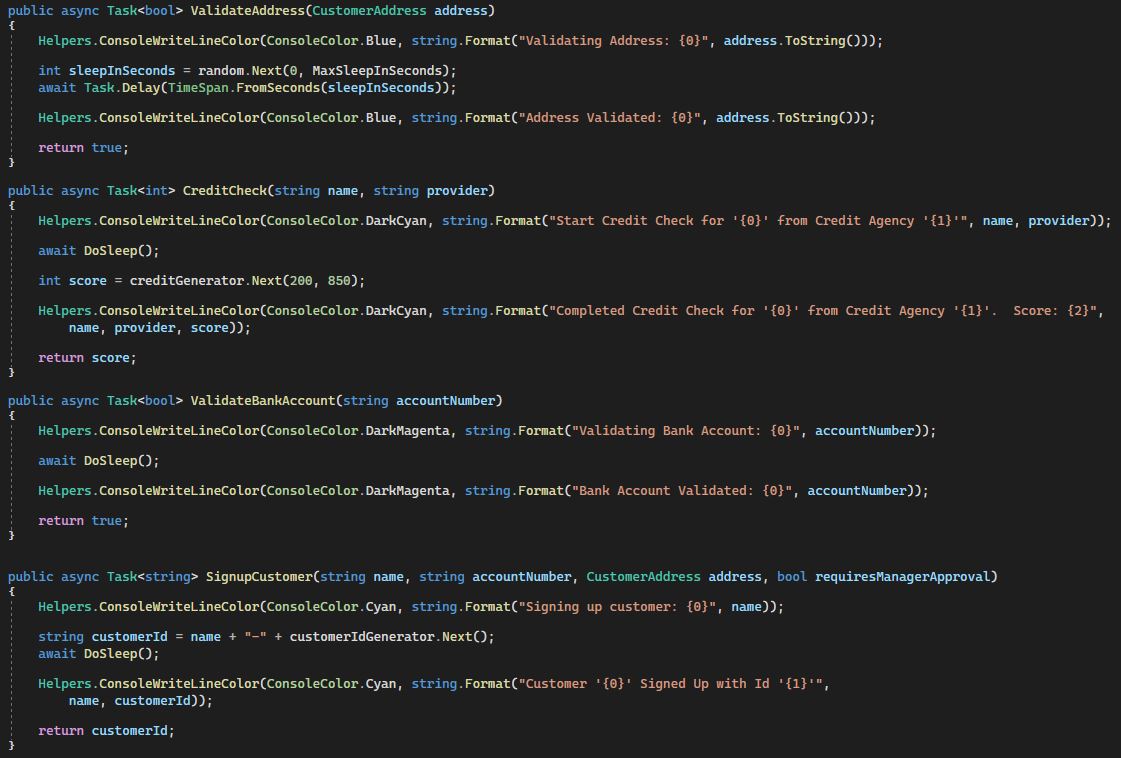
In Figure 1, we see that 3 activities are Async Methods that return the Task result of type Boolean. Each of these methods calls the corresponding sub-methods in Figure 2. This performs the validation of the Address, Bank Account, and Check Credit Score. In addition, we have the 4th activity, Signup Customer, which generates and returns the Customer ID.

Async Task Activities

Fig. 1

Task Activities_Durable Task Framework

Fig. 2

Figure 3 shows the implementation of Task Orchestration. Thus, each created orchestration instance executes all declared activities. Based on the result of the checks, the last activity returns the result as ‘User Signed up ID’ or ‘Rejected’.

Task Orchestration

Fig. 3

Key Takeaways

  • With the Durable Task Framework, Microsoft provides a simple option for building robust, distributed, and scalable services. DTFx has built-in state persistence and program execution checkpoints.
  • By implementing The Durable Task Framework, you can manage all system logic from one place and define the process flow.
  • The Durable Task Framework uses Event Sourcing to store all actions in Azure Table Storage. You can resume the processes from the past or continue the process from the point where the action was interrupted.
Microsoft Azure-Using External Data Into KQL

How To Use External Data Into KQL?

In many businesses, Azure is becoming the infrastructure backbone. It has become imperative to be able to query Azure using KQL, to gain insights into the Azure services your organization utilizes. In this post, let’s understand how to explore logs in Azure data storage using an external data file into KQL.

Highlights:

  • What Is Kusto Query Language (KQL)?
  • Sample Use Cases For Demo
  • Prerequisites
  • Simple Method For Basic Use Case
  • Alternative Method For Enhanced Use Case
  • Key Takeaways


What Is Kusto Query Language?

KQL, which stands for Kusto Query Language, is a powerful tool to explore your data and discover patterns, identify anomalies and outliers, create statistical models, and more. The language is used to query the Azure Monitor Logs, Azure Application Insights, Azure Resource Explorer, and others.

Sample Use Cases For Demo

1. Basic use case (solved using a simple method)

  • Imagine you have a set of servers and applications hosted in Azure.
  • You have configured logs & metrics collection using Azure monitoring services.
  • You must query the logs to find out applications that are hitting high processor utilization.

2. Enhanced use case (solved using an alternative method)

  • You must query the logs to find out only selected applications/serves that are hitting high processor utilization.
  • For every server, the threshold is different.
  • You want to control which serves to be queried.
  • You want to dynamically update thresholds for different computers.
  • You don’t want to update the KQL query.
Note:

  • For this demo purpose, we are using a log analytics workspace provided by Microsoft in their documentation for KQL/Kusto language. Please access the demo logs here for free.
  • To display the storage role, we have created a storage account in our subscription and blob container to host some files.

Prerequisites

  • Azure Subscription
  • Azure Storage Account (Blob Container) and/or AWS S3 Bucket
  • Azure Log Analytics Workspace (Azure Monitoring Service)

Simple Method For Basic Use Case

Let’s first explore the sample data available for the demo.

  1. Open your favorite browser and go to thislink.
  2. If you are already logged into Azure, it will open directly, else it will ask you to sign in.
  3. After signing in, a new query window is displayed.Microsoft Azure Monitoring Logs-DemoLogsBlade
  4. On the left side of the panel, you can explore tables and queries available in the demo workspace.Microsoft Azure-Logs Demo
  5. Copy & Paste the following code into new query 1.
InsightsMetrics
| where TimeGenerated > ago(30m)
| where Origin == “vm.azm.ms”
| where Namespace == “Processor”
| where Name == “UtilizationPercentage”
| summarize avg(Val) by bin(TimeGenerated, 5m), Computer //split up by computer
| join kind=leftouter (Computers) on Computer
| where isnotempty(Computer1)
| sort by avg_Val desc nulls first

Microsoft Azure-Sample Query

6. Click Run and you will see the following output.Microsoft Azure-Sample Query Results

Query only selected computers from KQL

1. Update the query to add a static list of computers from which you want to query logs.

let Computers = datatable (Computer: string)
[
“AppFE0000002”,
“AppFE0000003”,
“AppFE00005JE”,
“AppFE00005JF”,
“AppFE00005JI”,
“AppFE00005JJ”,
“AppFE00005JK”,
“AppFE00005JL”
];
InsightsMetrics
| where TimeGenerated > ago(30m)
| where Origin == “vm.azm.ms”
| where Namespace == “Processor”
| where Name == “UtilizationPercentage”
| summarize avg(Val) by bin(TimeGenerated, 5m), Computer //split up by computer
| join kind=leftouter (Computers) on Computer
| where isnotempty(Computer1)
| sort by avg_Val desc nulls first


2. Run the query and you will get the following results.Microsoft Azure Query Logs-Results

3. Please make a note of the output, which is filtered only for target computers.

This is basic KQL.

Alternative Method For Enhanced Use Case

Store target computer details outside the query

(We have used a .csv file for the demo)

  • Create a simple .csv file and store it on Azure Storage Blob Container.KQL Demo KQL Demo Azure Storage Blob Container

Create SAS Token for delegated access to the container

1. We will supply delegated access to the storage container by creating a SAS token. Using this token, we can access the .csv file from the KQL query.Creating SAS Token

Read more on granting limited access to Azure Storage resources using shared access signatures (SAS).

2. Update query to pull details from .csv file and return computers that are marked “Yes” to monitor.

let Computers = externaldata(Computer: string, value: int, Monitor: string)[@’https://kmpsblogdemostorage.blob.core.windows.net/kqldemo/SelectedComputers.csv’ h@’?sp=r&st=2022-08-23T13:50:14Z&se=2022-08-24T13:50:14Z&spr=https&sv=2021-06-08&sr=c&sig=fJwl%2BTddL6lXV9WONj6bmvp61PDPbf94Ou%2Fp9pAtnYE%3D’] with (ignoreFirstRecord=true);
InsightsMetrics
| where TimeGenerated > ago(30m)
| where Origin == “vm.azm.ms”
| where Namespace == “Processor”
| where Name == “UtilizationPercentage”
| summarize avg(Val) by bin(TimeGenerated, 5m), Computer //split up by computer
| join kind=leftouter (Computers) on Computer
| where isnotempty(Computer1) and Monitor contains “Yes”
| sort by avg_Val desc nulls first

3. Run the query and you will get the following results.

Azure Blob Storage-Query

4. Now, toggle the Monitor condition to No for AppFE0000002 computer.

changed to

5. Update query to pull details from .csv file and return computers that are marked “NO” to monitor.

let Computers = externaldata(Computer: string, value: int, Monitor: string)[@’https://kmpsblogdemostorage.blob.core.windows.net/kqldemo/SelectedComputers.csv’ h@’?sp=r&st=2022-08-23T13:50:14Z&se=2022-08-24T13:50:14Z&spr=https&sv=2021-06-08&sr=c&sig=fJwl%2BTddL6lXV9WONj6bmvp61PDPbf94Ou%2Fp9pAtnYE%3D’] with (ignoreFirstRecord=true);
InsightsMetrics
| where TimeGenerated > ago(30m)
| where Origin == “vm.azm.ms”
| where Namespace == “Processor”
| where Name == “UtilizationPercentage”
| summarize avg(Val) by bin(TimeGenerated, 5m), Computer //split up by computer
| join kind=leftouter (Computers) on Computer
| where isnotempty(Computer1) and Monitor contains “No”
| sort by avg_Val desc nulls first

6. Run the query and you will get the following results.

Note: Replace the location code in the above query with the URL of your Azure blob container.

Access input file stored outside Azure Storage

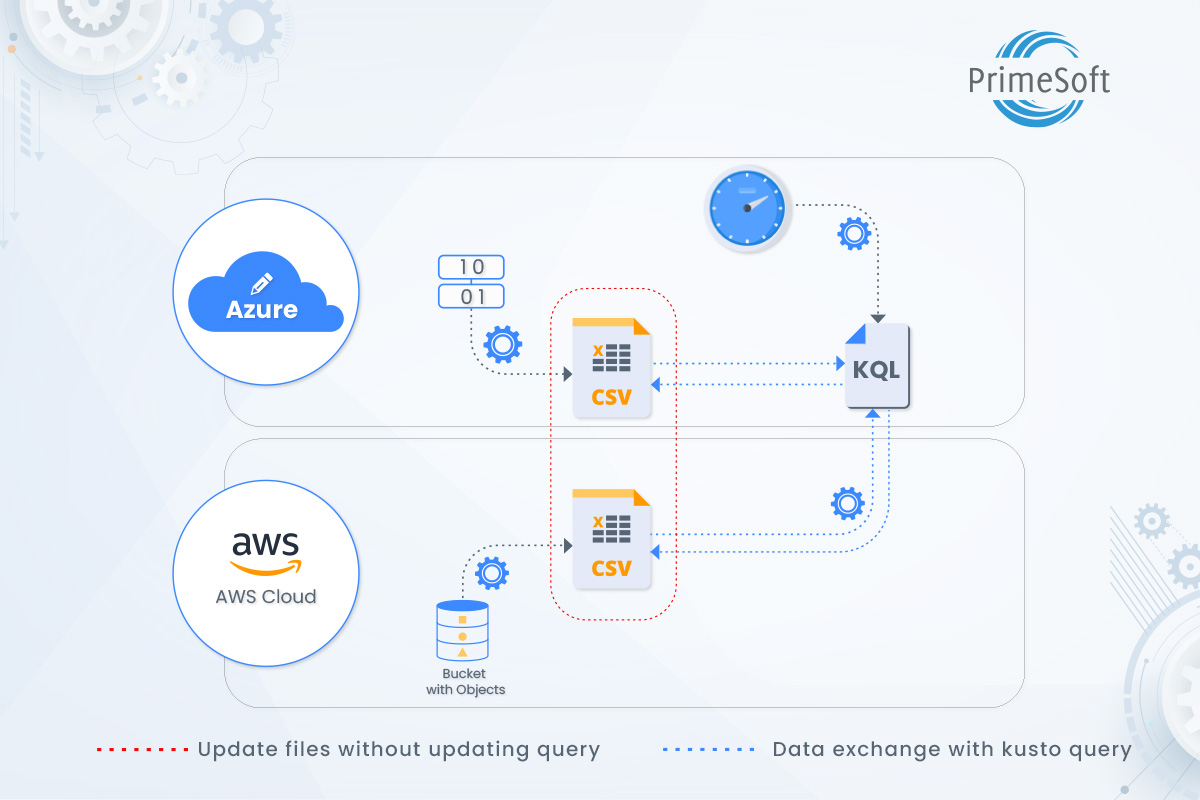
  • Update the query with the input file on the AWS S3 container. Run the query and you will get the same result.
let Computers = externaldata(Computer: string, value: int, Monitor: string)[@’https://psi-testing.s3.ap-south-1.amazonaws.com/SelectedComputers.csv’] with (ignoreFirstRecord=true);
InsightsMetrics
| where TimeGenerated > ago(30m)
| where Origin == “vm.azm.ms”
| where Namespace == “Processor”
| where Name == “UtilizationPercentage”
| summarize avg(Val) by bin(TimeGenerated, 5m), Computer //split up by computer
| join kind=leftouter (Computers) on Computer
| where isnotempty(Computer1) and Monitor contains “Yes”
| sort by avg_Val desc nulls first

Note: Replace the location code in the above query with the URL of your AWS S3 container.

Read more to know how to access the AWS S3 bucket.

Key Takeaways

The methods explained above offer the following benefits:

  • Provides flexibility to change target resources without updating the actual query.
  • Provides convenience to update input variables without complicating the query.
  • An overall query is compressed by decoupling target resources and threshold values that are defined outside the KQL query.
  • Most importantly, you can host your input file in any publicly accessible location, and still achieve the same functionality.


DevOps, Secops, FinOps, AIOps – Top tech trends you need to know about

DevOps, Secops, FinOps, AIOps – Top tech trends you need to know about

Advancement in technology has streamlined business processes in the most effective ways. Companies that are fast enough to adapt to these new trends gain a competitive edge over their counterparts. To scale businesses and ensure the best user experience, the decision-makers need to be agile and rope in the latest technology and services. Many small and big enterprises use the hybrid structure of on-premise infrastructure and cloud systems. Several others still have their apprehensions about taking the leap and migrating to cloud services.

Outsourcing Cloud and DevOps services can help you in your cloud transformation journey. Subscribing to these services can help you better collaborate, monitor, automate, and adopt the cloud into your business to achieve higher efficiency, greater agility, fast-paced deployment, and quicker time-to-market.

What are we going to cover in this blog?

  1. What is Agile Methodology?
  2. What is Agile Methodology in software development?
  3. What is DevOps and how it works?
  4. Why do we need DevOps?
  5. What is SecOps?
  6. How different is SecOps from DevSecOps?
  7. Why do we need SecOps?
  8. What is FinOps?
  9. Why do we need FinOps?
  10. What is AIOps?
  11. Why do we need AIOps?
  12. Can embracing these latest cloud trends accelerate business processes?

When it comes to product development, the process goes beyond the simple plan, development, and delivery model. It needs to be powered by cloud-based services. Today, tech terms like DevOps, SecOps, FinOps, and AIOps are not new to people. But, are they fully aware of these and their benefits? How can these recent trends be adapted to accelerate the product development process? 

These are not simply terms that are clubbed with the word ‘Ops.’ This quirky combination of words holds a lot of significance in product development. DevOps, SecOps, FinOps, and AIOps work in tandem in the software development process. However, these trends, especially DevOps, are often confused with Agile Methodology. So, before we dive deep into these term concepts, let’s understand how similar or different these are from Agile Methodology.

What is Agile Methodology?   

Agile methodology is specifically designed for project management and software development teams to provide the best customer experience through its interactive and quick response approach. The Agile methodology process helps break down the entire software development process into multiple phases and ensures continuous evaluation. It is known for its iterative approach that involves constant collaboration between the stakeholders and developers to identify opportunities, eliminate bugs and implement changes faster at every stage. These smaller units are integrated at the end for final testing. The whole idea is to align the development process with customer needs and software requirements. It is an effective process where teams work together to add more value for customers and make it more reliable for them. Three commonly used agile frameworks for product development are Scrum, Kanban, and Extreme Programming (XP).

Agile methodology cycle

Plan – Design – Develop – Evaluate

What is Agile Methodology in software development?

  • Improves customer experience as it makes the product or software more user-friendly through its iterative approach
  • Improves productivity and quality as the methodology encourages to work in small teams who are focused on one phase at a time
  • Ensures high performance as the development process is tracked in every stage to add new opportunities and implement changes constantly
  • It primarily focuses on three core areas – collaboration, customer feedback, and small rapid releases throughout the Software Development Life Cycle (SDLC) process

What is DevOps and how it works?

DevOps is a core part of the product development process, which brings the software development and IT operations teams together. It eradicates the challenges of the traditional structure and establishes collaboration between these two teams throughout the application lifecycle. In simpler terms, DevOps is a culture that is put into action to accelerate delivery by automating and integrating the phases from design to product release.

Many companies have started adopting the DevOps culture, practices, and tools to digitally transform their business and maximize productivity. DevOps has been in the trend because it is not just a union between two core teams but also an efficient way to bridge the gap between the business, stakeholders, and customers. Unlike the traditional software development and infrastructure management process, DevOps enables organizations to provide value to their customers by delivering applications and services faster. It aligns multiple functions under the same realm, from development and testing to deployment and operations.

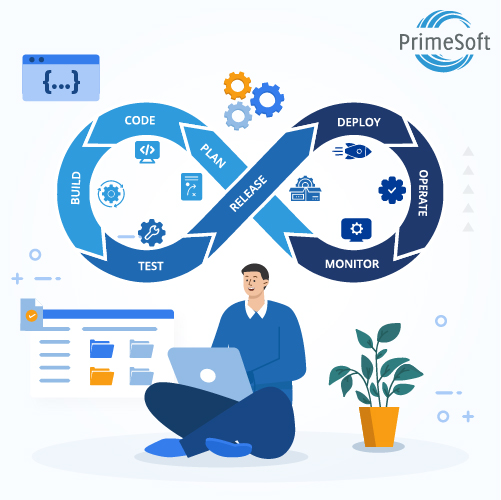
DevOps Methodology Cycle | PrimeSoft Solutions Inc.

DevOps methodology cycle

Plan-Build-Test-DeliverDeploy-Operate-Monitor

Why do we need DevOps?

Terms like CloudOps and ITOps, once popular among businesses, have now been overshadowed by upgraded and more functional concepts introduced in the modern Ops. One among those is known as DevOps. Ever wondered why? Please take a minute here to analyze what exactly you think has been missing in your software development process? Now read on to understand how DevOps methodology can play a key role in automating processes and achieving business goals. Let’s talk about how it can benefit your organization.

  • It doesn’t only focus on software development but ensures end-to-business solutions to its customers. It eliminates the involvement of any third-party vendors and directly meets the software as well as hardware needs of the customer
  • Continuous collaboration between teams and customers leads to optimum productivity resulting in high-quality products
  • Delivery of applications and services are moved at high velocity. The task is divided and distributed between development and operation teams as per their skill set to run the process seamlessly
  • It makes things easier by automating, integrating, and deploying the software faster and more efficiently
  • DevOps culture gives the scope for improvement and innovation in software development. It enables frequent releases where teams can innovate and rapidly adapt changes as per customer feedback and software requirement
  • DevOps increases reliability as its continuous integration and continuous delivery practices ensure that each change is safe and functional

Though DevOps streamlines the software development process from build to deploy, what about security? Let’s move beyond DevOps and focus on the new Ops cultures emerging in the market that can help you grow your business. Let’s start with cloud SecOps.

What is SecOps?

SecOps establishes a better collaboration between IT security and operations teams who work together to identify and prevent security threats on IT systems. So, a highly skilled team of developers, programmers, and IT security come together to monitor and assess risk and protect the company’s assets.

SecOps culture and practices ensure that the entire team is aware of and responsible for security.  Every member of the development cycle team must immediately report any suspected cyber threat so that the same can be mitigated before it becomes an issue. The aim is to improve business agility by keeping the systems and data secure. So, teams are encouraged to operate together and develop practical and adequate IT security measures.

Curious minds will question why these security challenges can’t be fixed with DevOps solutions. That’s because a large number of DevOps-driven application deployment tech adds to the security issues. Hence, the integration between DevOps and SecOps was invented.

How different is SecOps from DevSecOps?

DevSecOps facilitates collaboration and communication to integrate security into applications during the development cycle rather than treating it as an afterthought.

Though DevSecOps and SecOps tend to overlap, the fundamental difference is that DevSecOps injects security into the application development cycle. In contrast, the latter ensures security and compliance for IT systems on which the company assets are stored, including the app and its data.

Why do we need SecOps?

The global pandemic brought in the demand for remote work culture among organizations. This has significantly increased cyber security risks and the challenges to eradicating those. So, companies have started relying on dedicated SecOps teams who proactively work to detect, prevent and mitigate cyber threats. Some of its essential benefits are:

  •   Enables businesses to identify security concerns and develop solutions rapidly
  •     Ensures prevention of risks through process definition
  •   Continuously monitors activities in IT systems and keeps the assets and data secure
  •   Gets to the root of a security breach incident and prevent it from future occurrences
  •   Automates important security tasks which keep the records intact, hence making the auditing process more efficient
  •   The collaboration between teams ensures quick and effective response
  •   Increases productivity and streamlines businesses processes

To put these trends into action, finances play an important factor.  It is essential to keep a tab on the company’s finances and cut down on unnecessary expenses. This money management can be optimized by setting up a strong cloud FinOps operation.

FinOps Framework | PrimeSoft Solutions Inc.

What is FinOps?

These days, especially after the pandemic began, the demand for cloud migration from an on-premise infrastructure has been increasing rapidly among companies. Though this shift to the cloud can save you a lot of money, it is challenging to maintain finances on the cloud. FinOps, also known as cloud financial management, is an effective framework that lets you take control of your cloud spending.

As an organization, it may be difficult for you to keep a track of all the things you are paying for and whether they add any value to your requirements or not like an outdated service, tool, or even a license. FinOps is a cultural practice that enables organizations to maintain, manage and optimize cloud expenses, hence reinstating the core objective of deriving maximum value for minimal spending.

FinOps Framework 

Inform, Optimize, Operate

Why do we need FinOps?

The key objective of any business is to draw a balance between speed, cost, and quality. With the use of FinOps, this objective can be put into action. There are many reasons why organizations must adopt FinOps services and some of which are:

  • Establishes financial planning and governance to ensure maximum benefits
  • Provides complete transparency to control cloud costs and helps your teams to keep track of what they are spending and why
  • Enables you to take ownership of your cloud usage and set the cloud budget
  • Manages costs across departments

What is AIOps?

Anyone even with the slightest interest in the latest tech trends must be aware of Artificial Intelligence (AI), machine learning (ML), and big data. But what exactly is AIOps, and how can it be applied to your business?

In 2017, Gartner introduced Artificial Intelligence for IT Operations (AIOps) to the world and proved that digital transformation is incomplete without it. It is a platform that applies AI, machine learning, big data, and other analytic techniques to enhance IT operations.

AIOps enables collaboration and automation within a team and helps accelerate the delivery of various services to provide the best customer experience. It can turn out to be highly essential for an enterprise with cloud-based IT infrastructure as AIOps can reduce your cloud costs and improve cloud security through AI automation.

In short, AIOps implements smarter and more intelligent IT operations by allowing access to data from multiple sources, which can be shared across all teams for automation and analytics.

Why do we need AIOps?

IT organizations equipped with the latest technologies can identify, prevent and fix performance problems. However, as we grow with technology, it introduces new roadblocks in our direction. The hybrid multi-cloud infrastructure can create a lot of confusion and complexities about the big data accumulated from multiple sources. In situations like these, AIOps can act as a savior. Drawn by its brilliant practices and tools, businesses have rapidly started to adopt AIOps to make their IT operations more efficient. Read on to learn why your business needs AIOps.

  • It collects data and breaks those down into different units providing end-to-end visibility across IT systems. This helps teams to monitor data and network effectively
  • Its AI capabilities enable businesses to predict and prevent future problems by identifying the root cause
  • It is a next-generation IT solution that monitors applications and infrastructure within an organization and enhances its IT operations functions and performance

Can embracing these latest cloud trends accelerate business processes?

Yes, it certainly can! Practices and processes in digital space evolve every single day. It is necessary to catch up with the trends and stay updated with the latest technologies. However, it is not going to be an easy task and requires a lot of your time and effort. Subscribing to a credible Cloud and DevOps service provider can cushion your cloud journey and help you give your business a ‘face-lift’ much faster. 

PrimeSoft’s Cloud and DevOps services help businesses overcome unique challenges and generate value with enhanced security and faster performance in applications. Our software development and operation teams work together to deliver quality products using Azure, AWS, and Google Cloud platforms. We believe in providing services that are defined and delivered as per the specific requirements of our clients. Our client service speaks volumes about our work ethics and culture.

Primesoft is a global IT service provider with expertise in Product Development, Cloud + DevOps, and Quality Assurance. Our in-house industry experts can guide you to make more informed choices and serve your unique needs. And if you still feel unsure or need more clarity on this, we are here to help you out! 

Please feel free to reach out to us with your ideas in the comments below. You will hear from us at the earliest.